Data visualization is reshaping how nonprofits analyze their data and communicate their stories effectively. In today’s data-rich environment, it offers organizations a valuable way to turn complex information into actionable insights. In this article, we explore the practical benefits for nonprofits, important considerations for data visualization projects, and how organizations can utilize tools like Tableau and Power BI. While much of Vera’s services are centered on the Salesforce Platform – which itself offers easy-to-use Report and Dashboard capabilities – we find more and more organizations these days need to take their data visualization to the next level. Through real-world client examples, we demonstrate the tangible impact of data visualization in supporting nonprofit missions.
“Data visualization projects force organizations to have conversations about the state of their data. Are there gaps? Are there questions we can’t answer? Why can’t we answer those questions? When different teams/departments can see the story the data they collectively track tells, it only encourages good management data practices.”
- Hetile Dlamini, Senior Success Engineer, Vera Solutions

The Benefits of Data Visualization Tools
- Enhanced Reporting: BI tools go beyond Salesforce’s standard reporting capabilities, offering users greater control over visual design and formatting. This flexibility extends to reporting across not only Salesforce objects but other data sources as well.
- Facilitated Data-driven Decision-making: BI tools act as catalysts for crucial conversations that drive organizational growth by providing actionable insights derived from data analysis.
- Streamlined Data Collection: Automation features in BI tools simplify the process of gathering information from multiple sources, streamlining data consolidation processes.
- Unified Data View: BI tools can seamlessly aggregate data from multiple sources, providing a unified view that would typically be fragmented across different systems or databases.
- Operational Efficiency: Leveraging BI can drive more efficient resource allocation within nonprofit teams, optimizing operational efficiency.
- Data Quality Assurance: Dashboarding capabilities in BI tools enable nonprofits to identify and address potential issues with data quality, ensuring accurate and reliable decision-making.
“We have integrated our [Salesforce] solution with Power BI and this has been great for us. Going forward, we will be able to track our progress and analyze our data across the organization - from our fundraising department through to our grants department and our finance department as they all interlink into Power BI. The new solution we have with Amp Impact has really helped us to become more sophisticated in our analysis and reporting. It allows us to have one centralized area for all our analysis across our organization and it gives us instant updates across every department so it's more transparent and we can customize our reporting across everything."
- Joe Fletcher, IT Systems and Project Manager, Elton John AIDS Foundation

Which Data Visualization tool should you choose?
When reviewing data visualization tools for your nonprofit there are some key questions to consider, such as: Do you use any BI tools already? If yes, what are they and what limitations do you face? Are there specific insights you struggle to extract from your data? What are your reporting cycles and budget for ongoing license fees? What is your long-term BI vision, and who handles reporting? How do you source data, and do you perform regular data cleaning or transformation? Do you have data warehousing practices? Do you have internal capabilities or would you need to outsource these to a partner? If the latter, does the partner understand your organization and have the expertise in data analytics and visualization tools?
While the market offers many data visualization tools, two have been most widely adopted across the nonprofit sector: Tableau and Microsoft Power BI. These solutions seamlessly integrate with Salesforce Clouds and Amp Impact, offering numerous benefits for nonprofit organizations. Let’s examine how five clients have successfully utilized these tools to gain deeper insights and support data-driven decisions.
Salesforce Tableau
Tableau is a data visualization and analytics platform that enables organizations to see, understand, and act on their data to accelerate decision-making, eliminate repetitive tasks, and use AI-integrated intelligent analytics at scale.
Tableau Foundation is the data equity hub enabling nonprofit organizations to effectively and ethically use their data to advocate for change, bringing together software people and partners.
Smaller organizations can leverage Tableau Foundation donated licenses
Below are a few examples of how organizations are leveraging Tableau for data visualization:
1. A global health organization dedicated to advancing health equity brings its Amp Impact project data to Tableau to enhance data-driven decision-making. This integration offers comprehensive insights into program, project, and institutional progress and results. With an internal data team managing Tableau, they support 300-400 users, ensuring data management for informed decision-making and impactful outcomes.
2. One of our funder clients focused on expanding equality and opportunity utilizes Tableau to visualize financial and grant data from Amp Impact and Salesforce and embeds Tableau dashboards back into Salesforce. Higher-level dashboards show aggregated performance trends and impact data from multiple globally funded programs, providing insights into funding effectiveness and enabling aligned future investment decisions.
3. An international graduate school initiative sought to enhance its Salesforce reporting and dashboard capabilities with Tableau. Leveraging Vera Solutions’ Managed Engineering Support Services, they extract data from Amp Impact for comprehensive KPI reporting, analyzing admissions data, getting a holistic view of all programs in Tableau (including those not tracked in Salesforce), and ensuring effective communication with key stakeholders.
Microsoft Power BI
Below are a few examples of how organizations are leveraging Power BI for data visualization:
1. The Aga Khan Foundation (AKF) links Salesforce reports to Power BI to create dashboards that visualize each country’s and theme’s annual results. The results dashboards are shared with over 3,000 staff globally, facilitating greater accessibility and understanding of AKF’s key metrics and annual achievements.
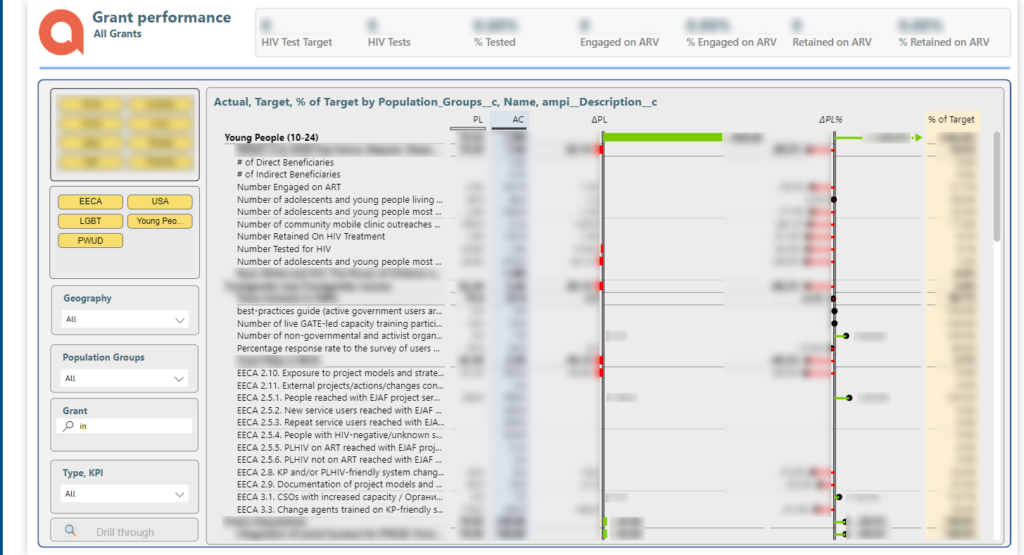
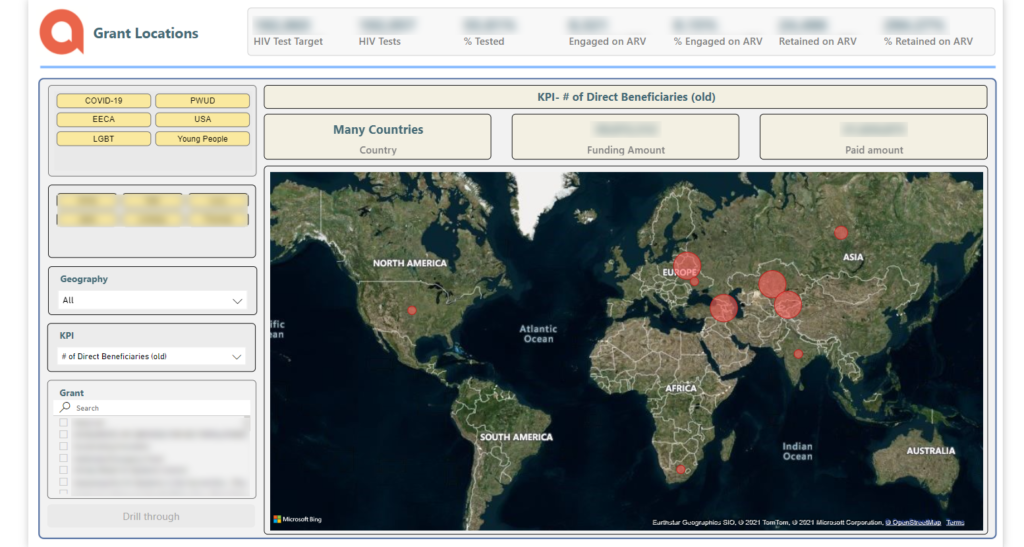
2. The Elton John AIDS Foundation (EJAF) leverages Amp Impact to manage portfolio, impact, grant, and financial data, providing real-time updates in a centralized platform. By harnessing Power BI alongside this data system and grantee portal, EJAF has significantly enhanced transparency in reporting across internal departments, grantees, board members, and the public. This integrated approach enables EJAF to readily track the flow of funds, offering clear insights and transparency into their global financial inflows and outflows.
Taking nonprofit data to the next level
The evolution of nonprofit data management from digital transformation to the adoption of data visualization and analytics tools has revolutionized the way organizations operate and make decisions. By centralizing and managing data in solutions such as Salesforce and Amp Impact, and leveraging advanced tools like Power BI, and Tableau, nonprofits can extract actionable insights, enhance transparency, and drive meaningful change. As we look to the future, it’s clear that the effective utilization of data will continue to play a pivotal role in nonprofit success. By staying ahead of emerging trends and technologies, organizations can further amplify their impact, ultimately advancing their missions and creating positive change in communities worldwide.